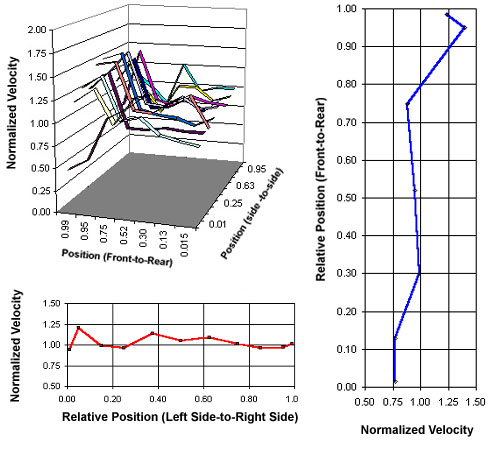
The first step in data reduction is to calculate a plane average velocity using a weighted-area averaging method. This value is used to normalize individual test measurements for a particular plane, (see adjacent figure). For instance, it the weighted plane average from the test was 50-fps and one of the perimeter measurements was 65-fps, then the normalized value would be 1.3 (=65/50).
Normalization provides an intuitive display for understanding distribution across a test plane. A value of 1.0 corresponds to the plane average (design value). Ideally, all measured values would be within a few percent of that value. Values >1.00 indicate FAE rates above design.

Normalized values are also converted to equivalent operating velocities based on unit operation and design. These data are compared to known FAE areas to establish a link between flowrates and FAE. There is also an unmeasured ash loading distribution that is factored into this analysis (from computer modeling). These distributions can be used to identify high FAE regions that have yet to be discovered. See Erosion Fundamentals for further explanation.
The analysis done in this step provides a clear picture of the gas flow distribution throughout the backpass and an explanation for particular features exhibited. It is the springboard from which an FAE control strategy is developed.
The next step leading to FAE control is to finalize the strategy for redistribution of ash and local velocity reduction. These steps are summarized in the Design of FAE Baffles and Ash Plugging Controls sections.